

1. Introduction
With the advancement of technology, the use of advanced ultrasonic equipment as an alternative to the radiographic test for weld inspection has been favored by many companies and employers and is expanding, and the best method for making a practical comparison is to draw probability of detection diagrams.
2. POD diagram drawing method
The POD curve is used to describe the ability of an NDT technique to reveal defects. But it is worth noting that each NDT method has different capabilities in different defects. Therefore, to get a better result, all types of defects should be checked and a diagram should be obtained at the end. In the first stage, different types of defects are examined, and then defects such as lack of fusion and porosity are examined.
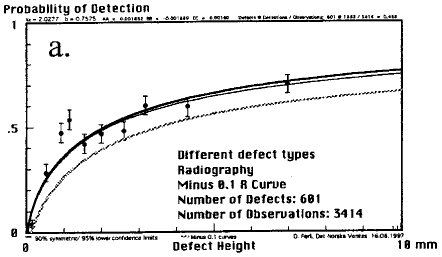
These charts include 3 curves as follows
Best correct probability (thick line)
95% confidence (thin line)
Radiographic reference curve 1 (dotted line)
In all PODs, the curve is plotted as a function of the height of the defects, considering the dominant defect intensity parameter.
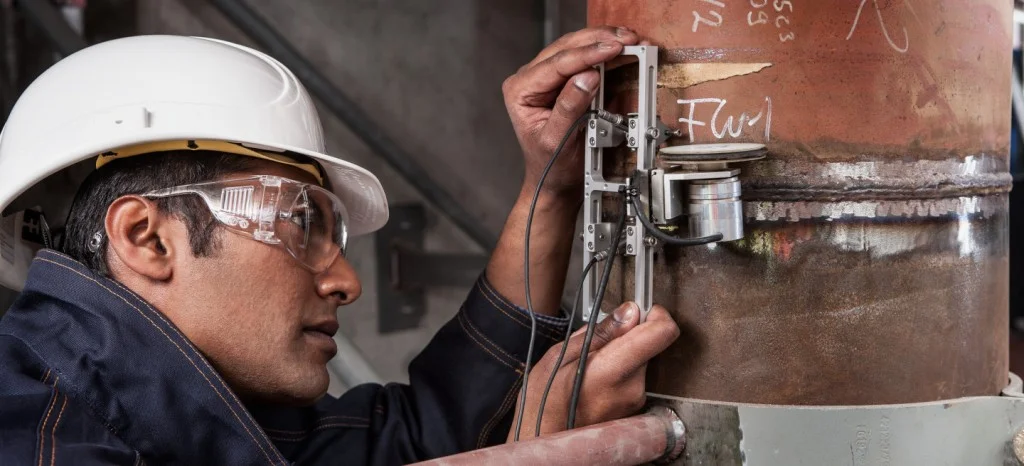
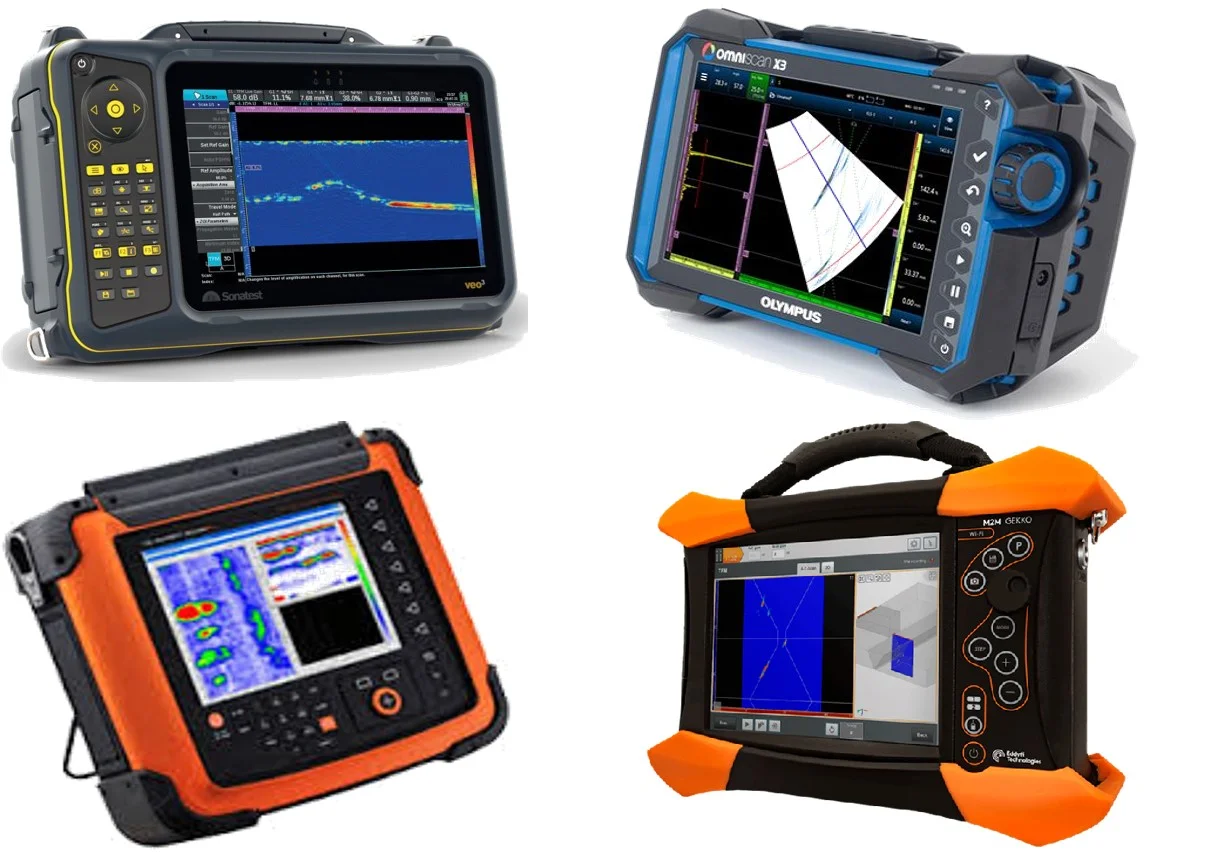
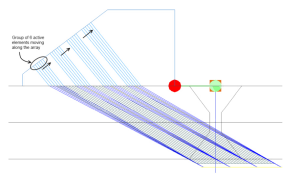
3. NDT methods used
In the study conducted according to the nature of different traditional ultrasonic methods (UT) to record defects caused by reflection, advanced ultrasonic TOFD to record defects caused by sound diffraction (Diffraction) and radiography with X-rays (RT) It has been done on defects.
4. Obtained graphs
4.1. Diagram a is the result of various types of defects in the radiography method. The resulting diagram includes 601 defects and 3414 times of observations that have been tested by the radiography method.
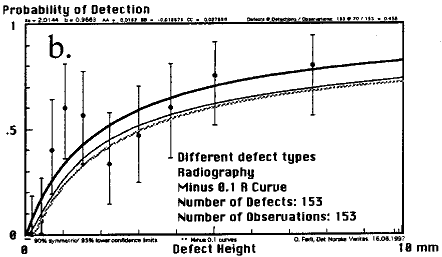
4.2. Diagram b of the types of defects in the radiography method
In this chart, 153 observation samples have been randomly selected.
As can be seen, the 95% confidence limit line is very close to the minus 0.1 curve and still meets the requirements for the reference method.
Thus, Figure b shows that multiple samples of observations are required to satisfy the criterion.
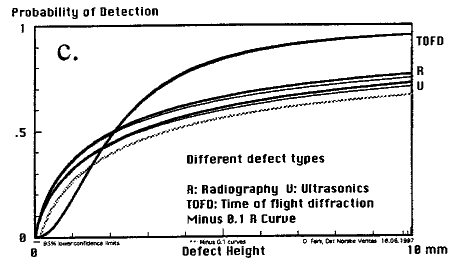
4.3. Chart c result of checking with 3 methods of all possible defects
The diagram shows a comparative curve for all possible defects up to a height of 10 mm in peripheral welds.
It can be seen that the TOFD method with a long distance has the highest probability of finding defects compared to conventional ultrasound and radiography, and radiography with a small distance has a higher probability than ultrasound.
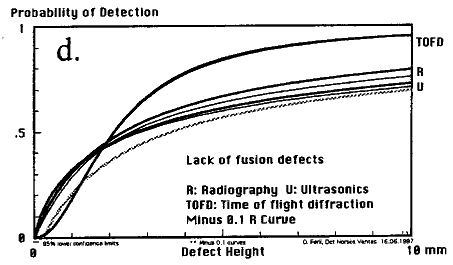
4.4. Chart d from LOF analysis
This graph is a comparison curve for the Lack of Fusion defect in pipeline peripheral welds.
It can be seen that the TOFD method has the highest probability of finding defects compared to conventional ultrasound and radiography and is close to 95%.
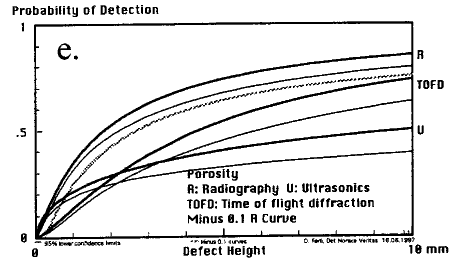
4.5. Diagram e result of Porosity investigation
This graph shows the comparative curve for the Porosity defect in the peripheral welds of the pipeline.
In the diagram, it is clear that the radiographic method has the highest probability of finding porosity defects in a way that the probability of finding defects in the TOFD method increases with the height of the defect.
In the diagram, it is clear that this amount of ultrasonic sound intensity did not meet the requirements of the acceptance criteria, and higher sensitivities should be used to reveal these defects by ultrasonic.
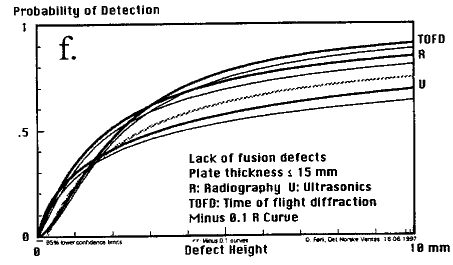
4.6. Diagram f of the result of LOF investigation with a thickness of less than 15 mm
The graph shows the comparative curve for the Lack of Fusion defect in sheet thicknesses less than 15 mm (average 13 mm) of pipeline peripheral welds.
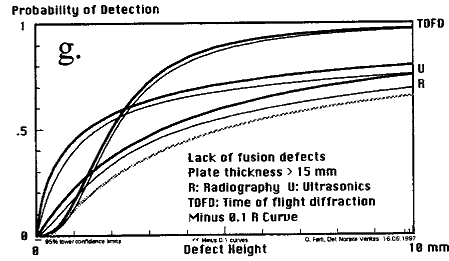
4.7. Chart g result of LOF investigation thickness more than 15 mm
The diagram shows the comparative curve for Lack of Fusion defects in sheet thicknesses greater than 15 mm (average 18 mm) of pipeline peripheral welds. In both cases, TOFD sampling has advantages over the other two methods.
It can be seen that ultrasound has a lower ability in low thicknesses and has an advantage over radiography in higher thicknesses.
It can also be seen that the TOFD method is superior to radiography and ultrasound in both thicknesses.
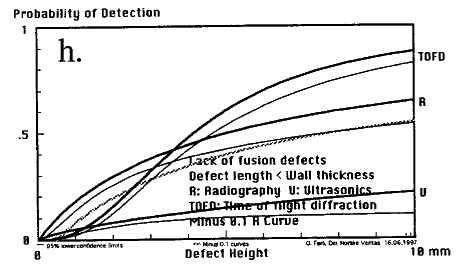
4.8. Diagram h resulting from the examination of defects with a length less than one thickness
The diagram shows a comparative curve for the Lack of Fusion defect with a length less than the thickness of the pipeline’s peripheral welds. It can be seen that ultrasonic has the least ability and TOFD has the most ability
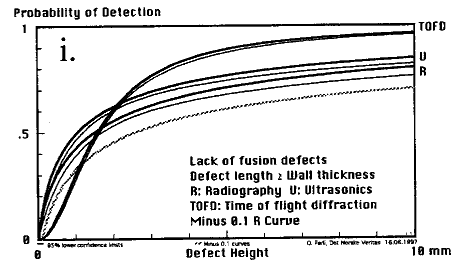
4.9. Diagram i is the result of examining defects with a length greater than one thickness
The graph below shows a comparative curve for the Lack of Fusion defect with a length greater than the thickness of the pipeline’s peripheral welds.
It can be seen that radiography has the least ability and TOFD has the most ability
- 5. Conclusion
Considering the ability of different tests to find defects, the acceptance criteria should be chosen according to the methods. Otherwise, the final result of rejecting and accepting the welds will be accompanied by a lot of error.
To choose the method, first of all, the thickness of the pipe and then the importance of defects should be considered.
To increase the probability of finding, the accuracy of diagnosis and the size of defects, it is better to use a combination of methods.
It is not correct to determine the ability of a method based only on a defect, and different methods have different capabilities for different defects